Graphic samples

A map of North America shows monarch migration patterns. Western monarchs travel from west of the Rocky Mountains to the coast of California to overwinter. Overwintering is a semi-dormant state where monarchs cluster in trees during the winter. Some of the western monarchs may also travel to overwintering sites in Mexico. Eastern monarchs travel from areas in the north east of the Rocky Mountains to overwintering sites in Mexico. After winter, monarchs travel from overwintering sites back to their summer sites in northern parts of the U.S. and Canada. An infographic of two illustrations of a male monarch butterfly and a female monarch butterfly. Male monarch butterflies, as shown in the illustration, are orange in color and have thin black veins on their wings. They also have pouches on each of the back of their wings. Female monarchs are a darker orange and have thicker black veins on their wings.

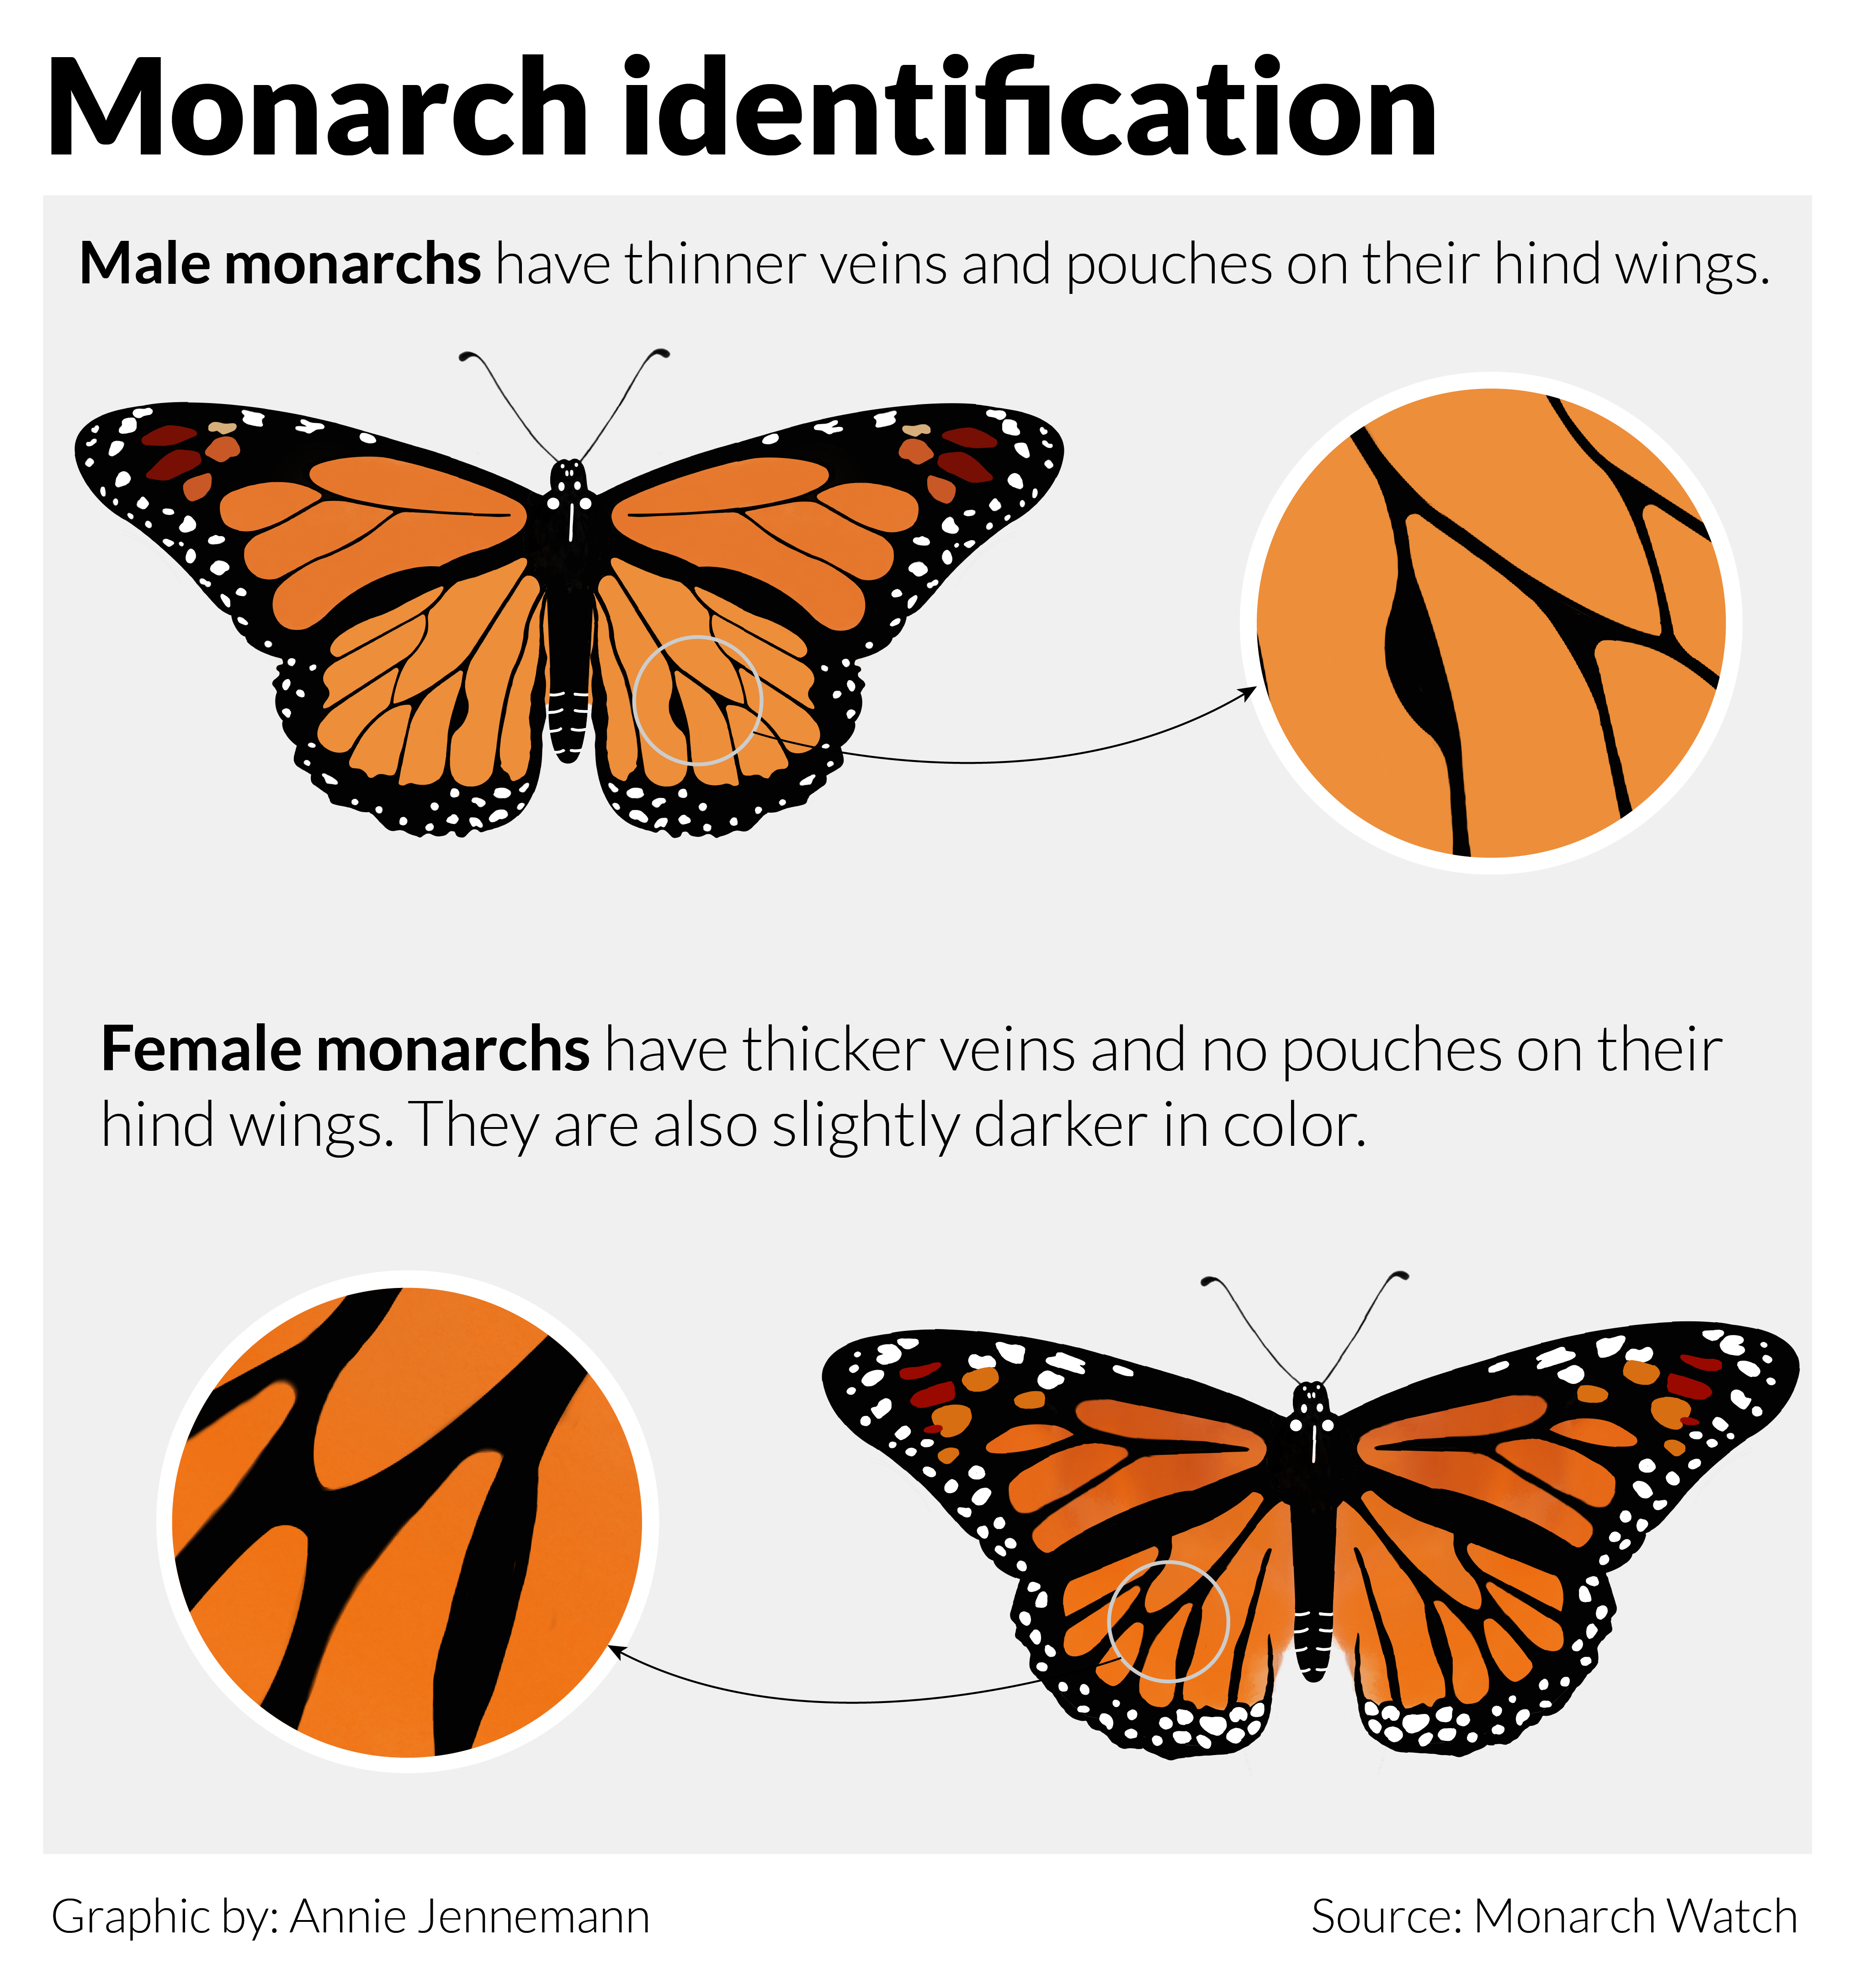
I created these graphics for story in Flatland I reported about monarchs being listed as endangered by the IUCN.

Download the monarch migration map Download the monarch illustration

Tools used: Adobe Illustrator, Procreate


An infographic showing the Missouri state senators who voted yes and who voted no on SB 391, which was passed in 2019. All 23 of the votes in favor of the bill were Republican senators in rural areas in Missouri. Of the 11 who voted no, 10 were Democratic senators from St. Louis and Kansas City areas. One republican, Mike Cierpiot voted no. Senate Bill 391 was passed in Missouri which prevents individual counties from implementing more
stringent regulations on agriculture operations than the state.

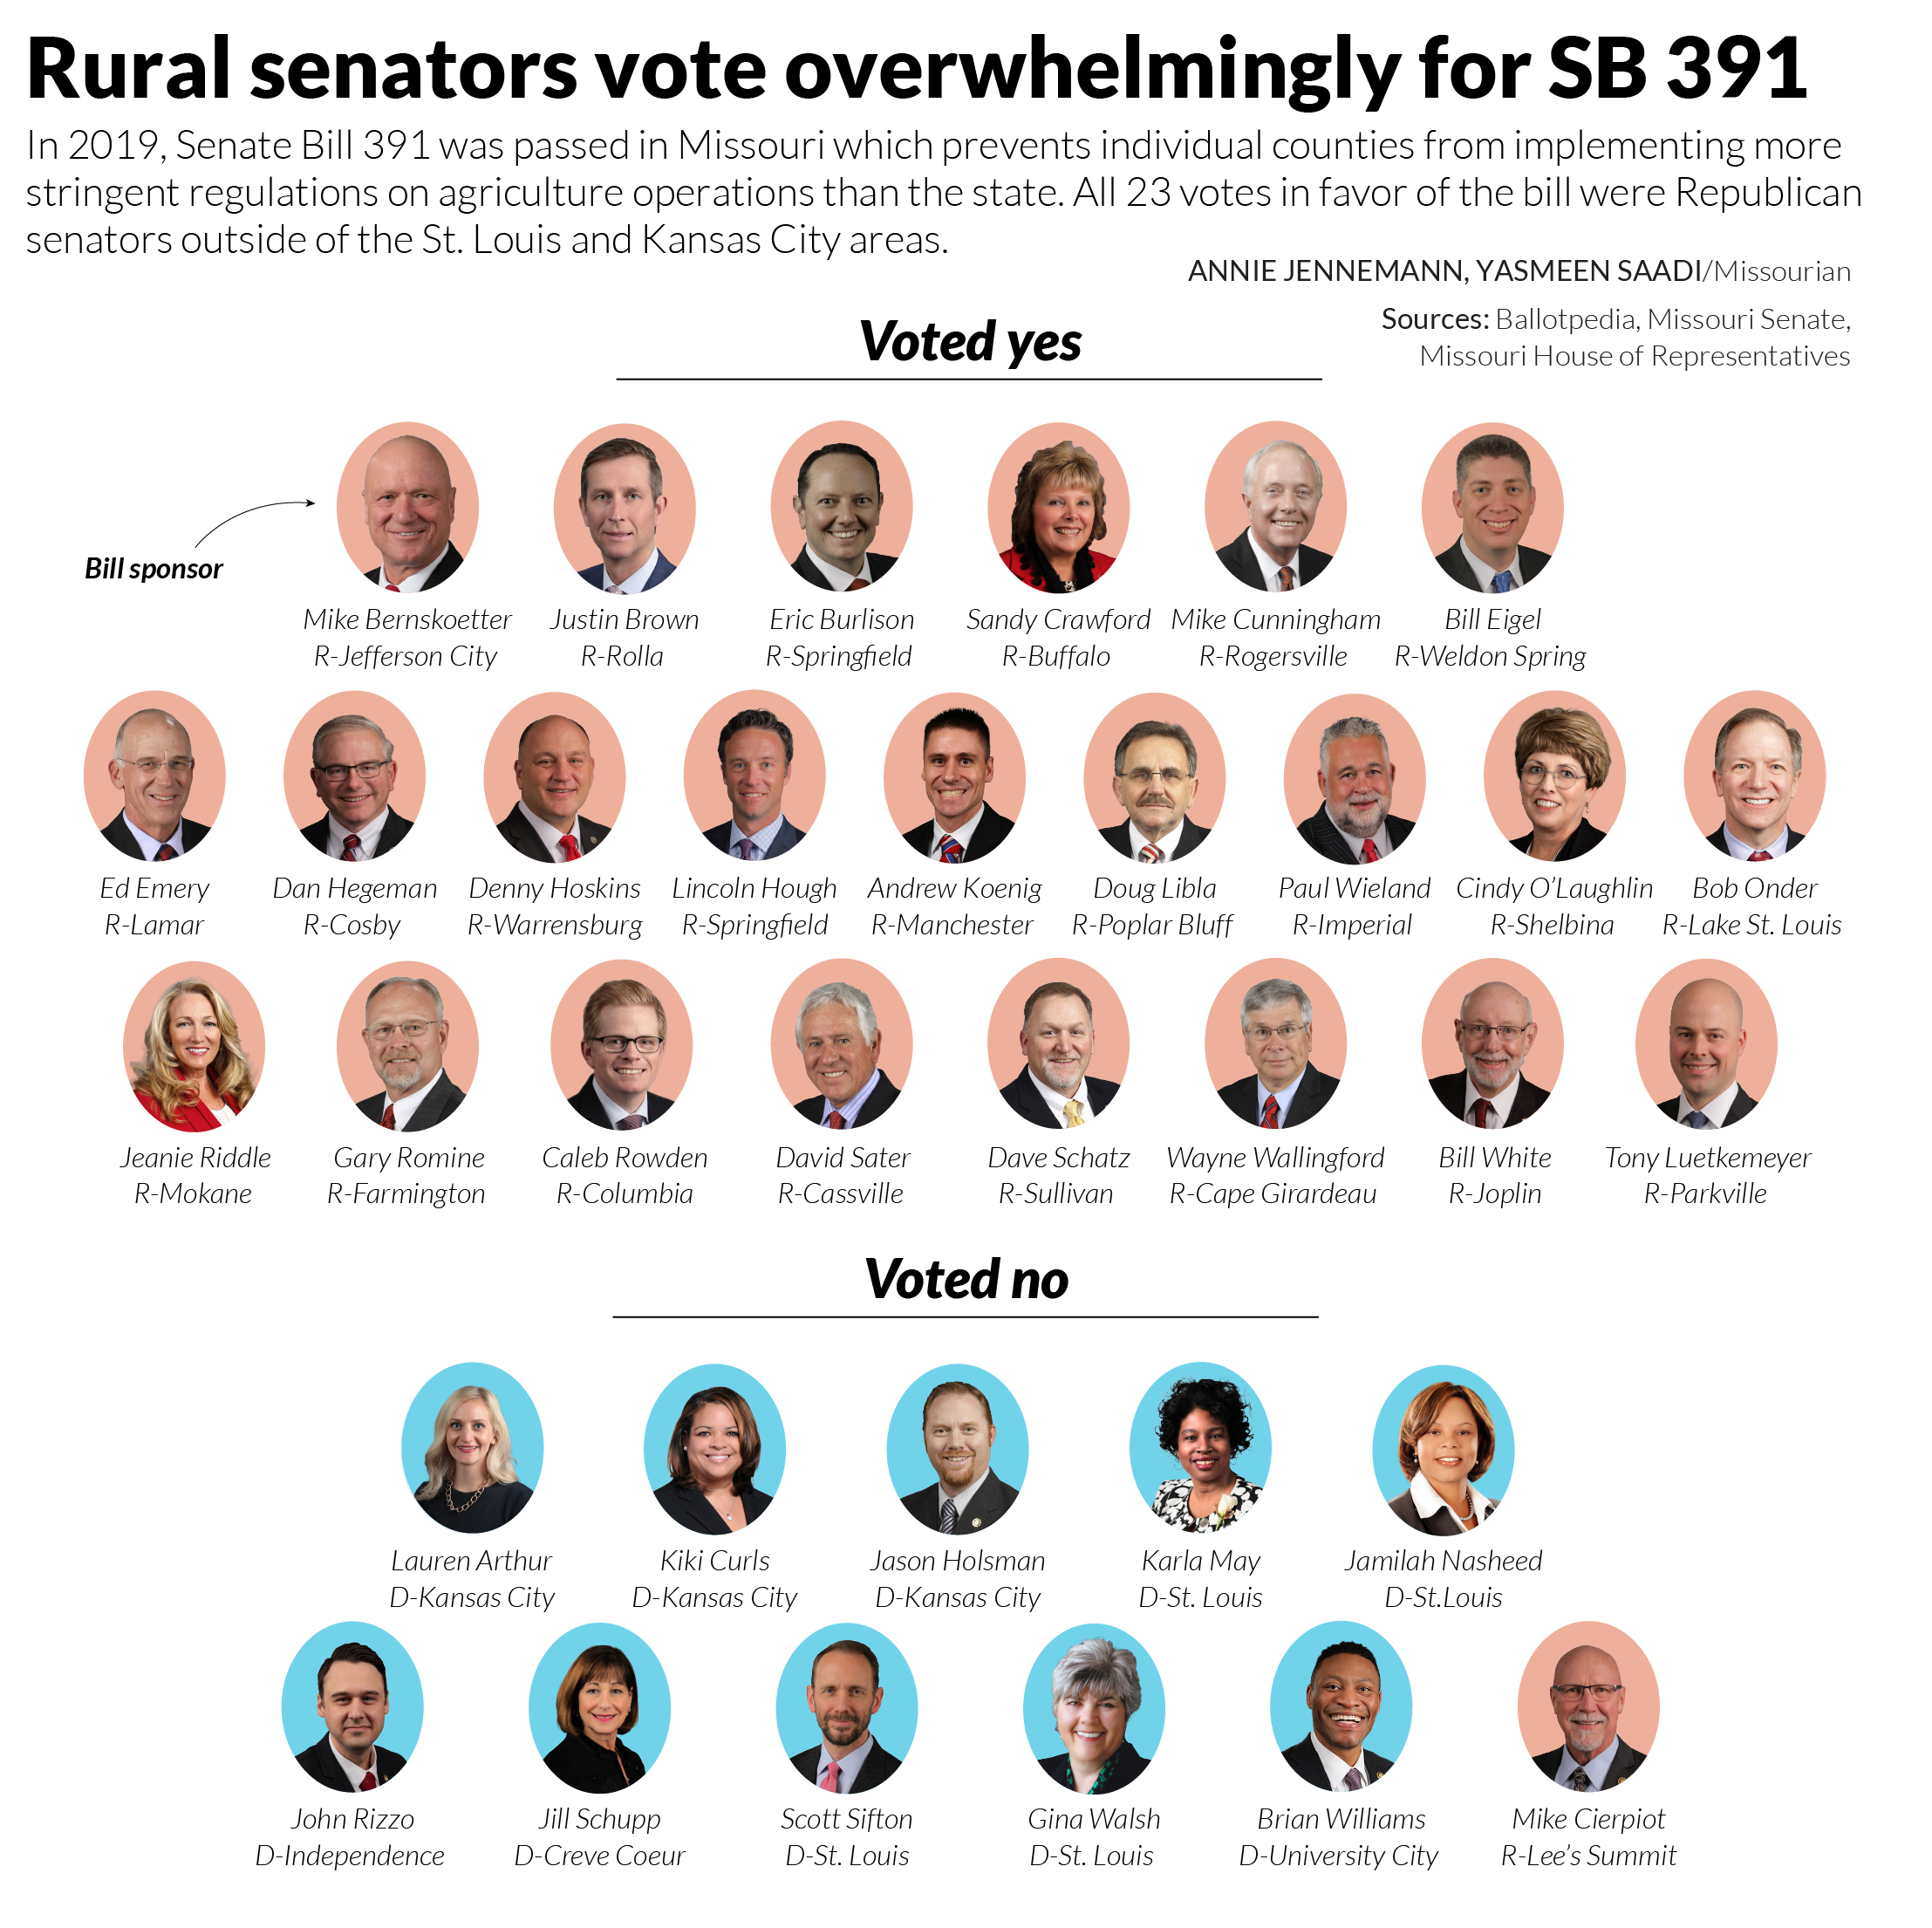
I created this graphic for a story about agriculture consolidation in Missouri. I used Photoshop to cut out the images and Illustrator for the layout.

Tools used: Adobe Illustrator, Photoshop

Download


A graphic of two maps of Missouri, one of Senate districts and one of House districts, shows how each representative and senator from each region voted on SB 391. The majority of each map is dark red which equals to a yes vote from a Republican-led district.

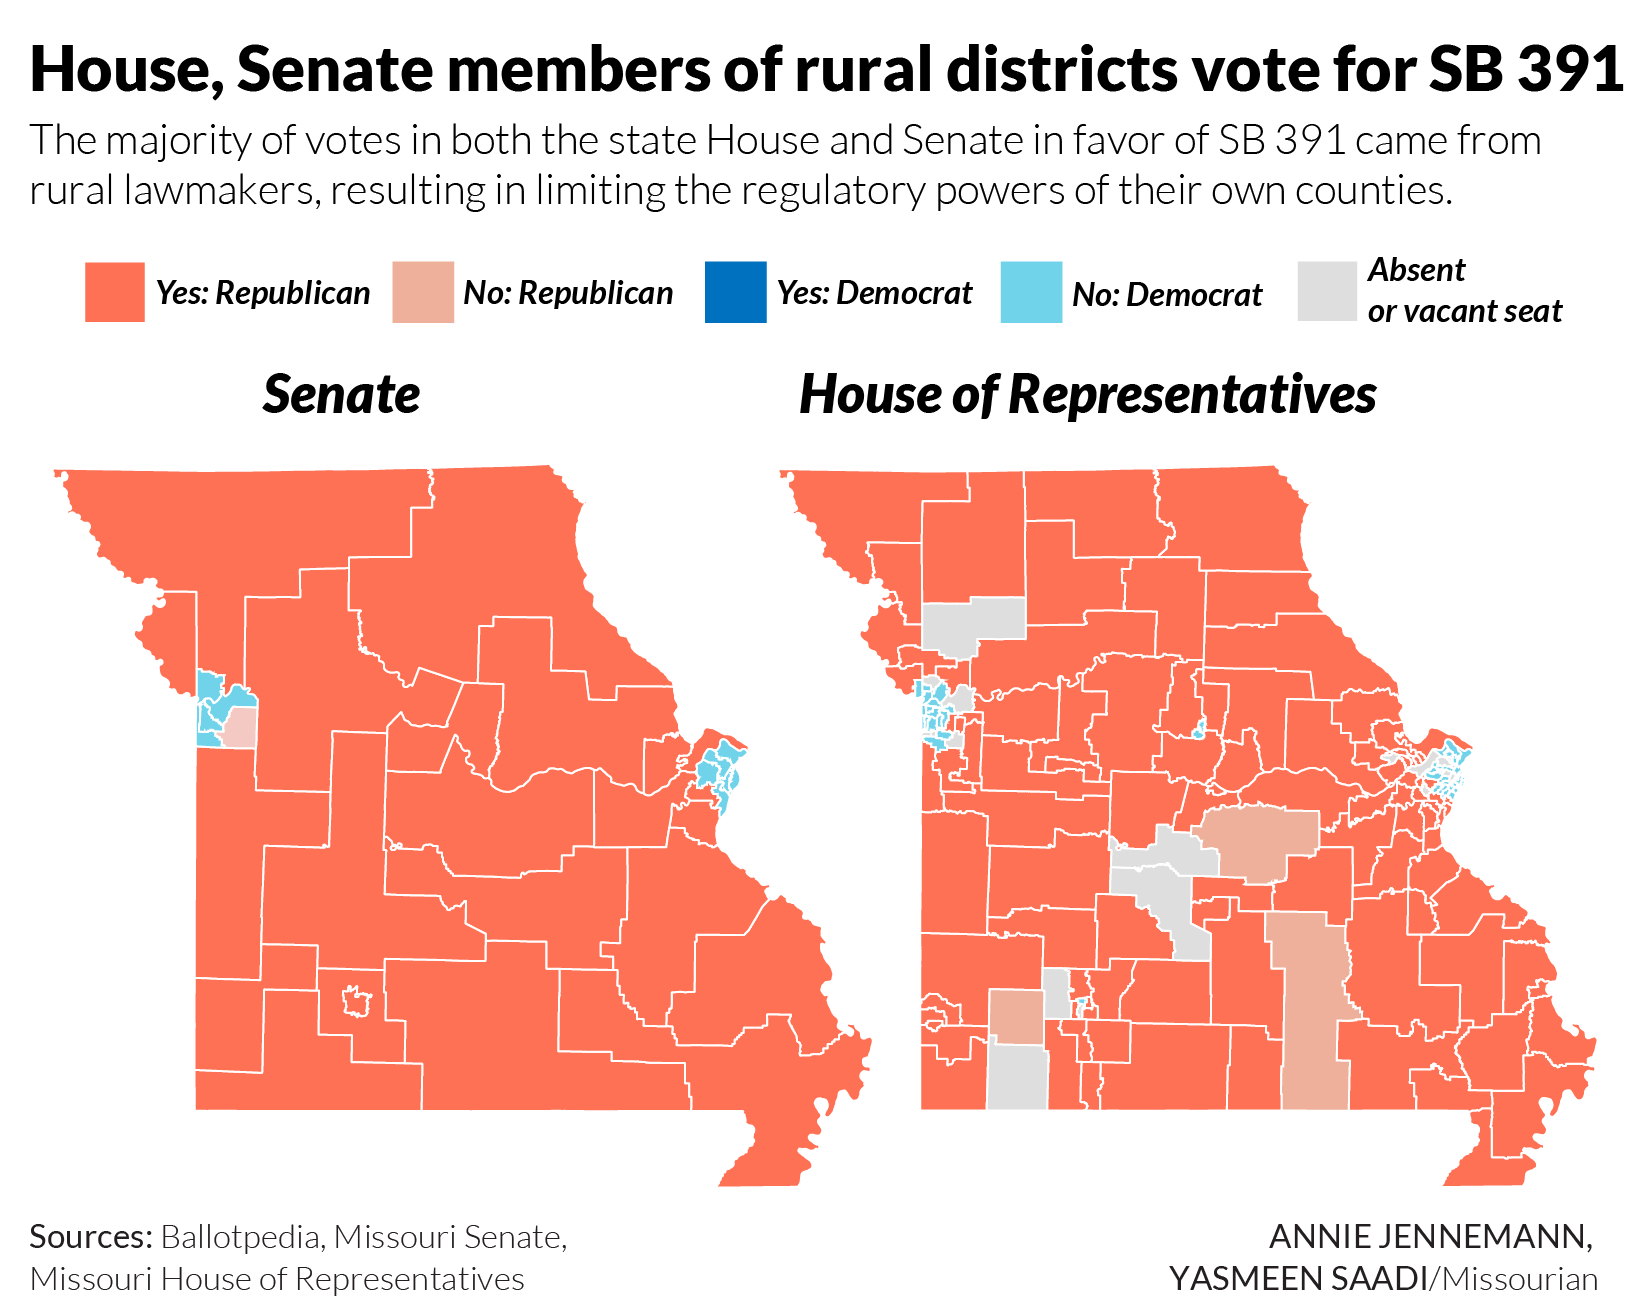
I created these maps for a story about agriculture consolidation in Missouri. I used QGIS to create and color code the maps, downloaded them as SVGs and designed the layout in Illustrator.

Tools used: Adobe Illustrator, QGIS

Download


A graphic of four maps of Missouri shows the change in the number of school districts with a four-day week from 2010 to 2022. In 2010, the Lathrop R-II School District in central northwest Missouri was the first to move to a four-day week. By the 2021-2022 school year, 119 districts had made the change.

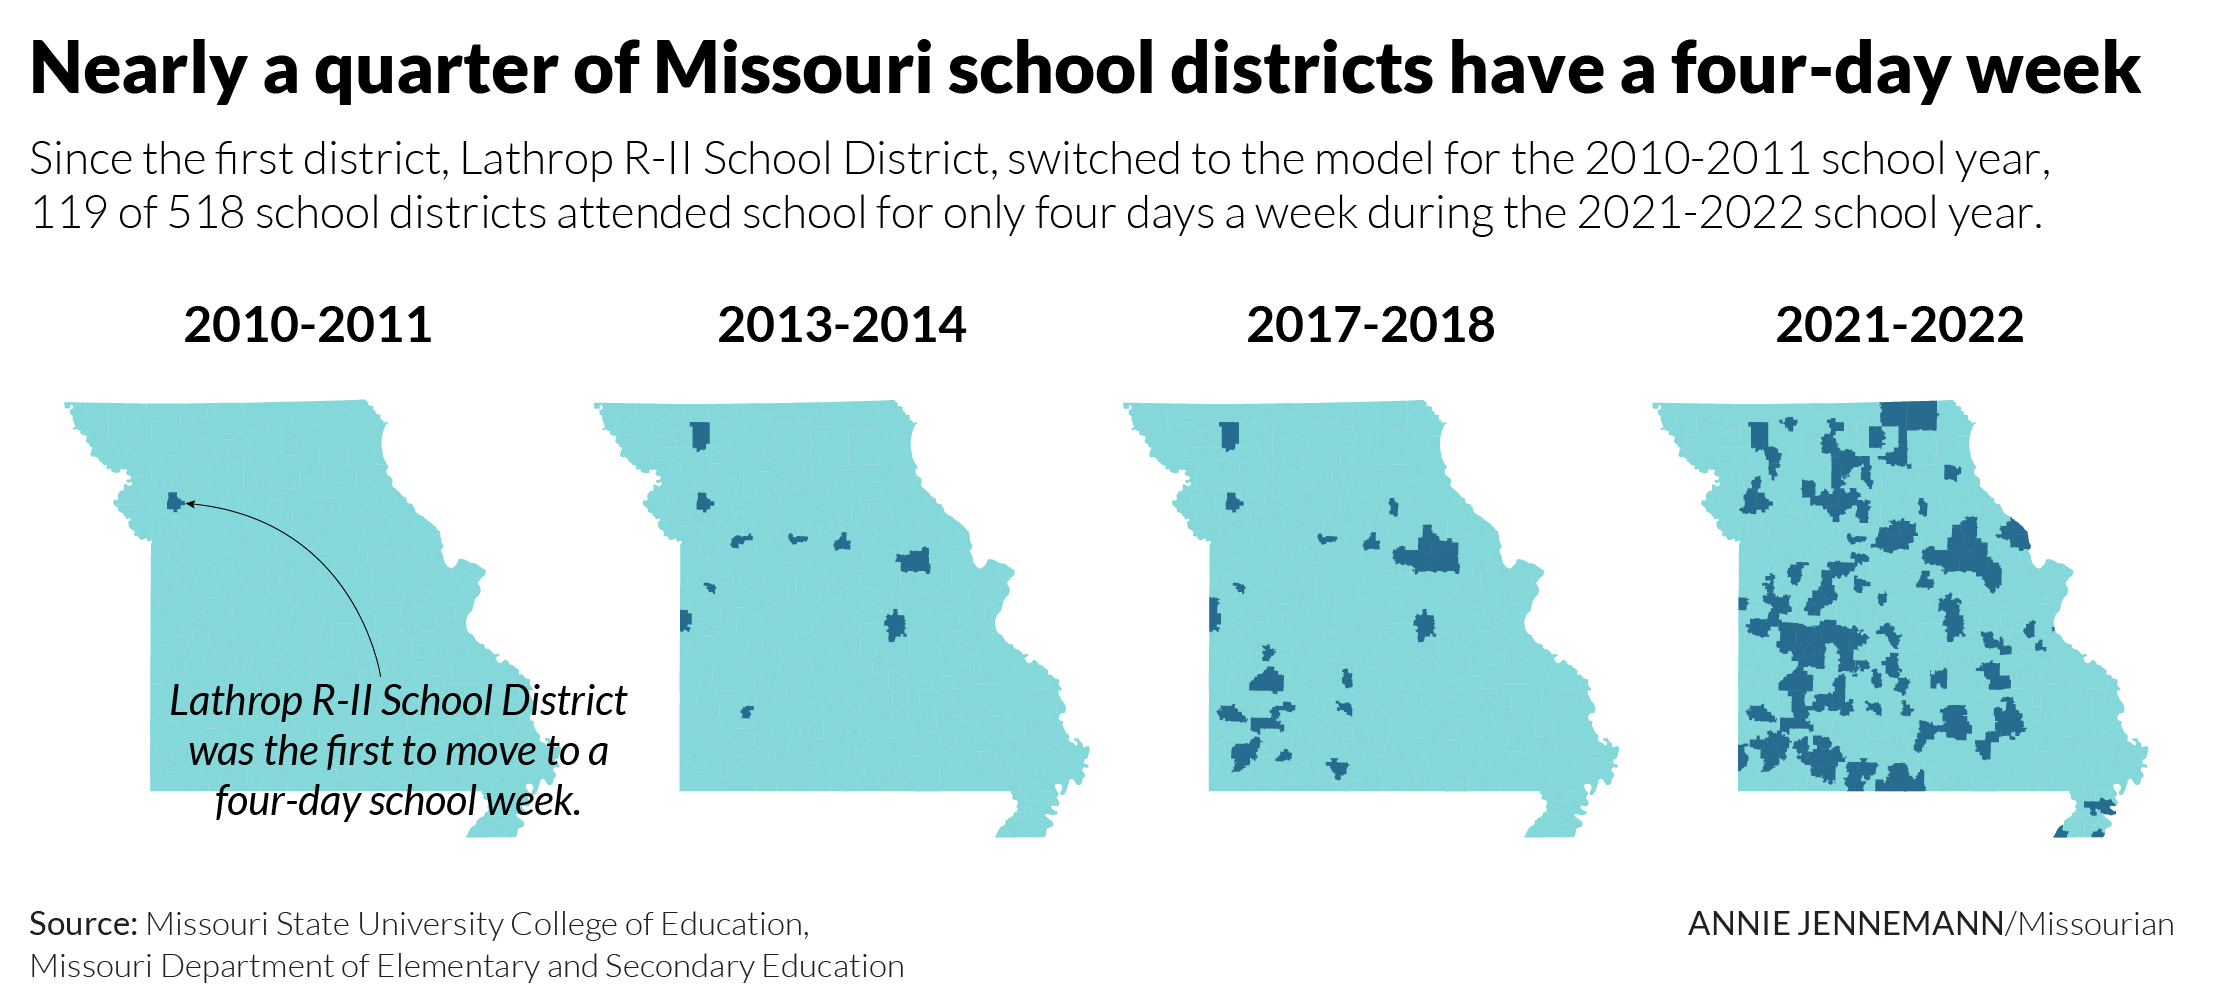
I created this map for a story about the four-day school week in rural Missouri. The story and graphics are a part of a bigger series called 2,500 Below about the changing landscapes of Missouri's small towns. I used QGIS to save the school district outlines as SVGs and uploaded them to Adobe Illustrator to create the layout.

Tools used: Adobe Illustrator, QGIS

Download


An infographic showing how the James Webb Space Telescope can see galaxies formed 13.5 billion years ago because of the way light travels. The farther away something is in space, the farther back in time it is. Webb detects light outside of the visible range at near- or mid-infrared wavelengths, or farther back in time that Hubble.

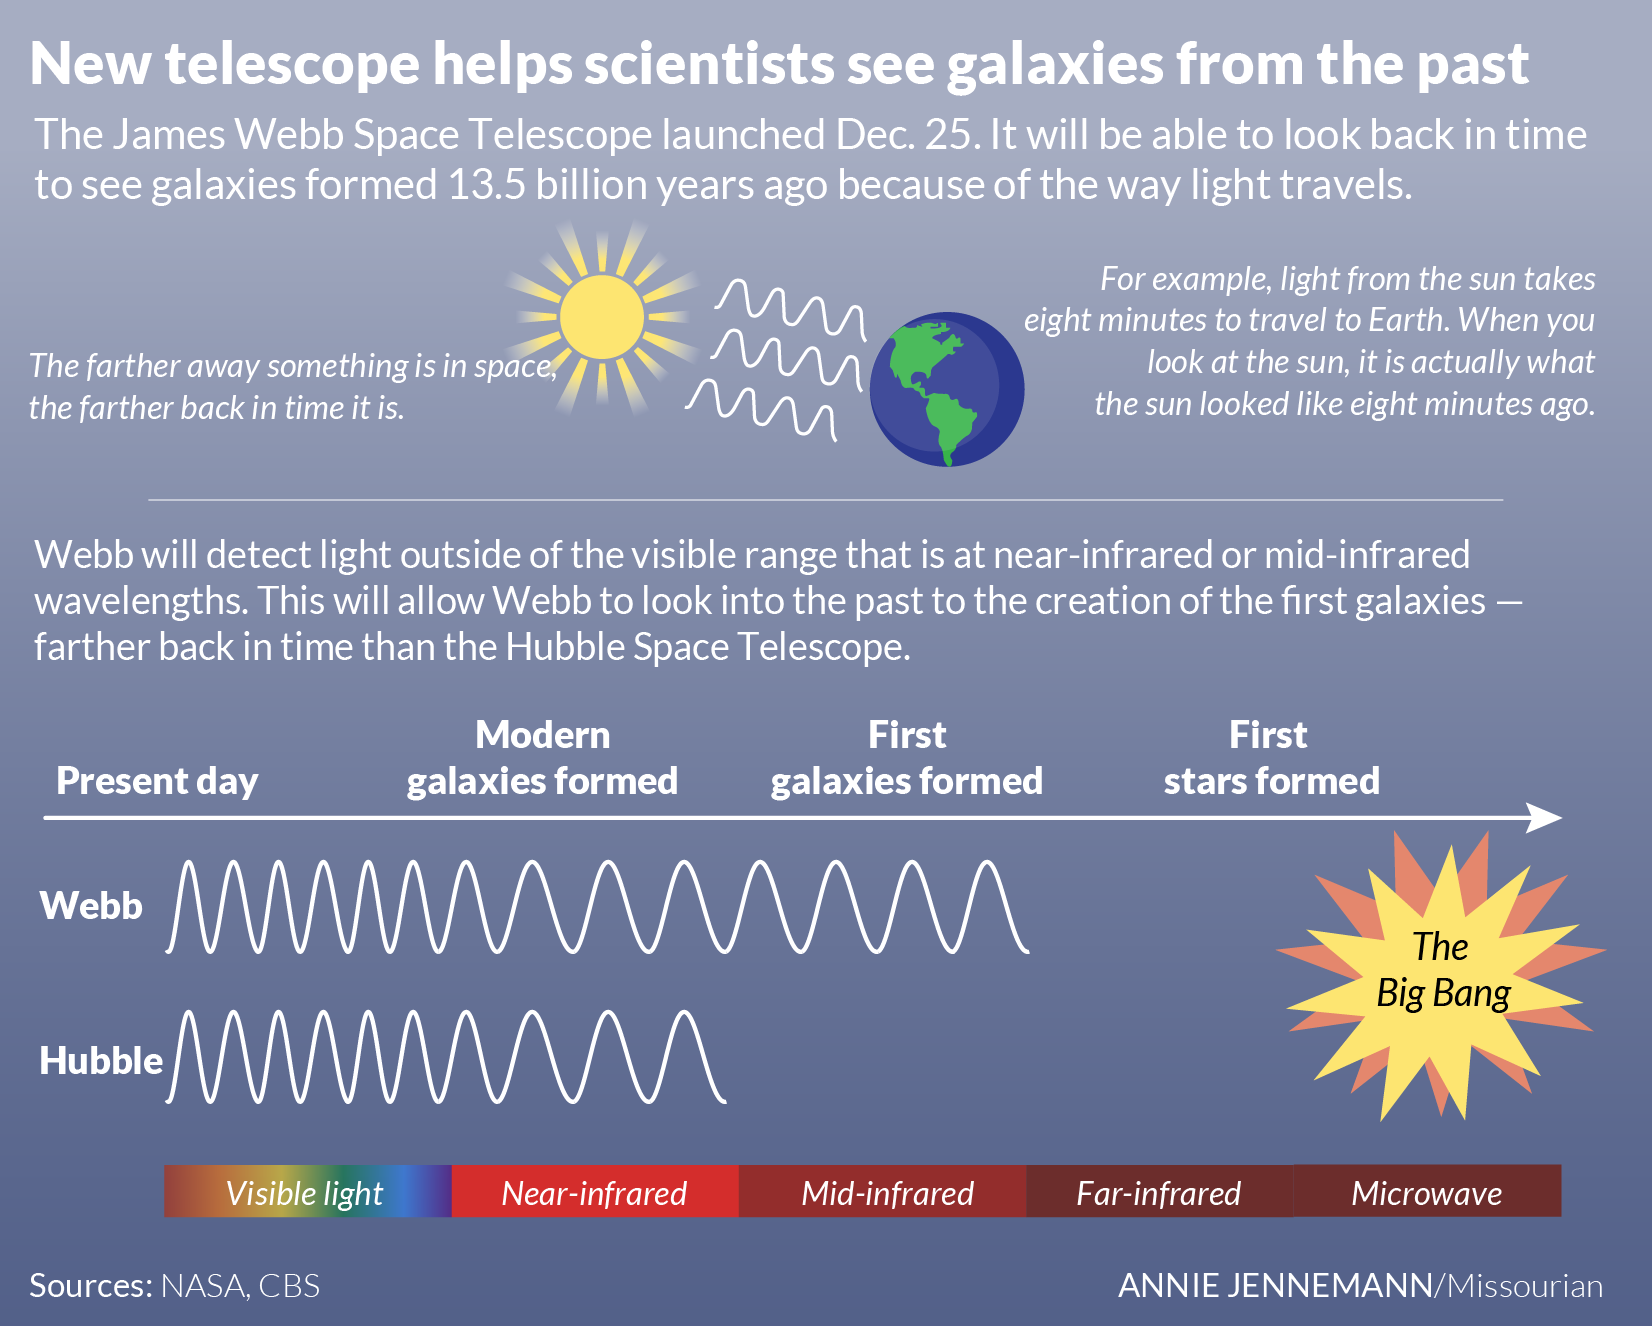
I created this infographic for a story about an MU professor being granted access to use the James Webb Space Telescope for the Columbia Missourian.

Tools used: Adobe Illustrator

Download


A bubble chart of Boone County showing priority 2 and 3 mines in Boone County. Over $7 million is still needed to reclaim all of the abandoned mines in the county, with a priority 3 mine in Prathersville requiring the most at $2.84 million.

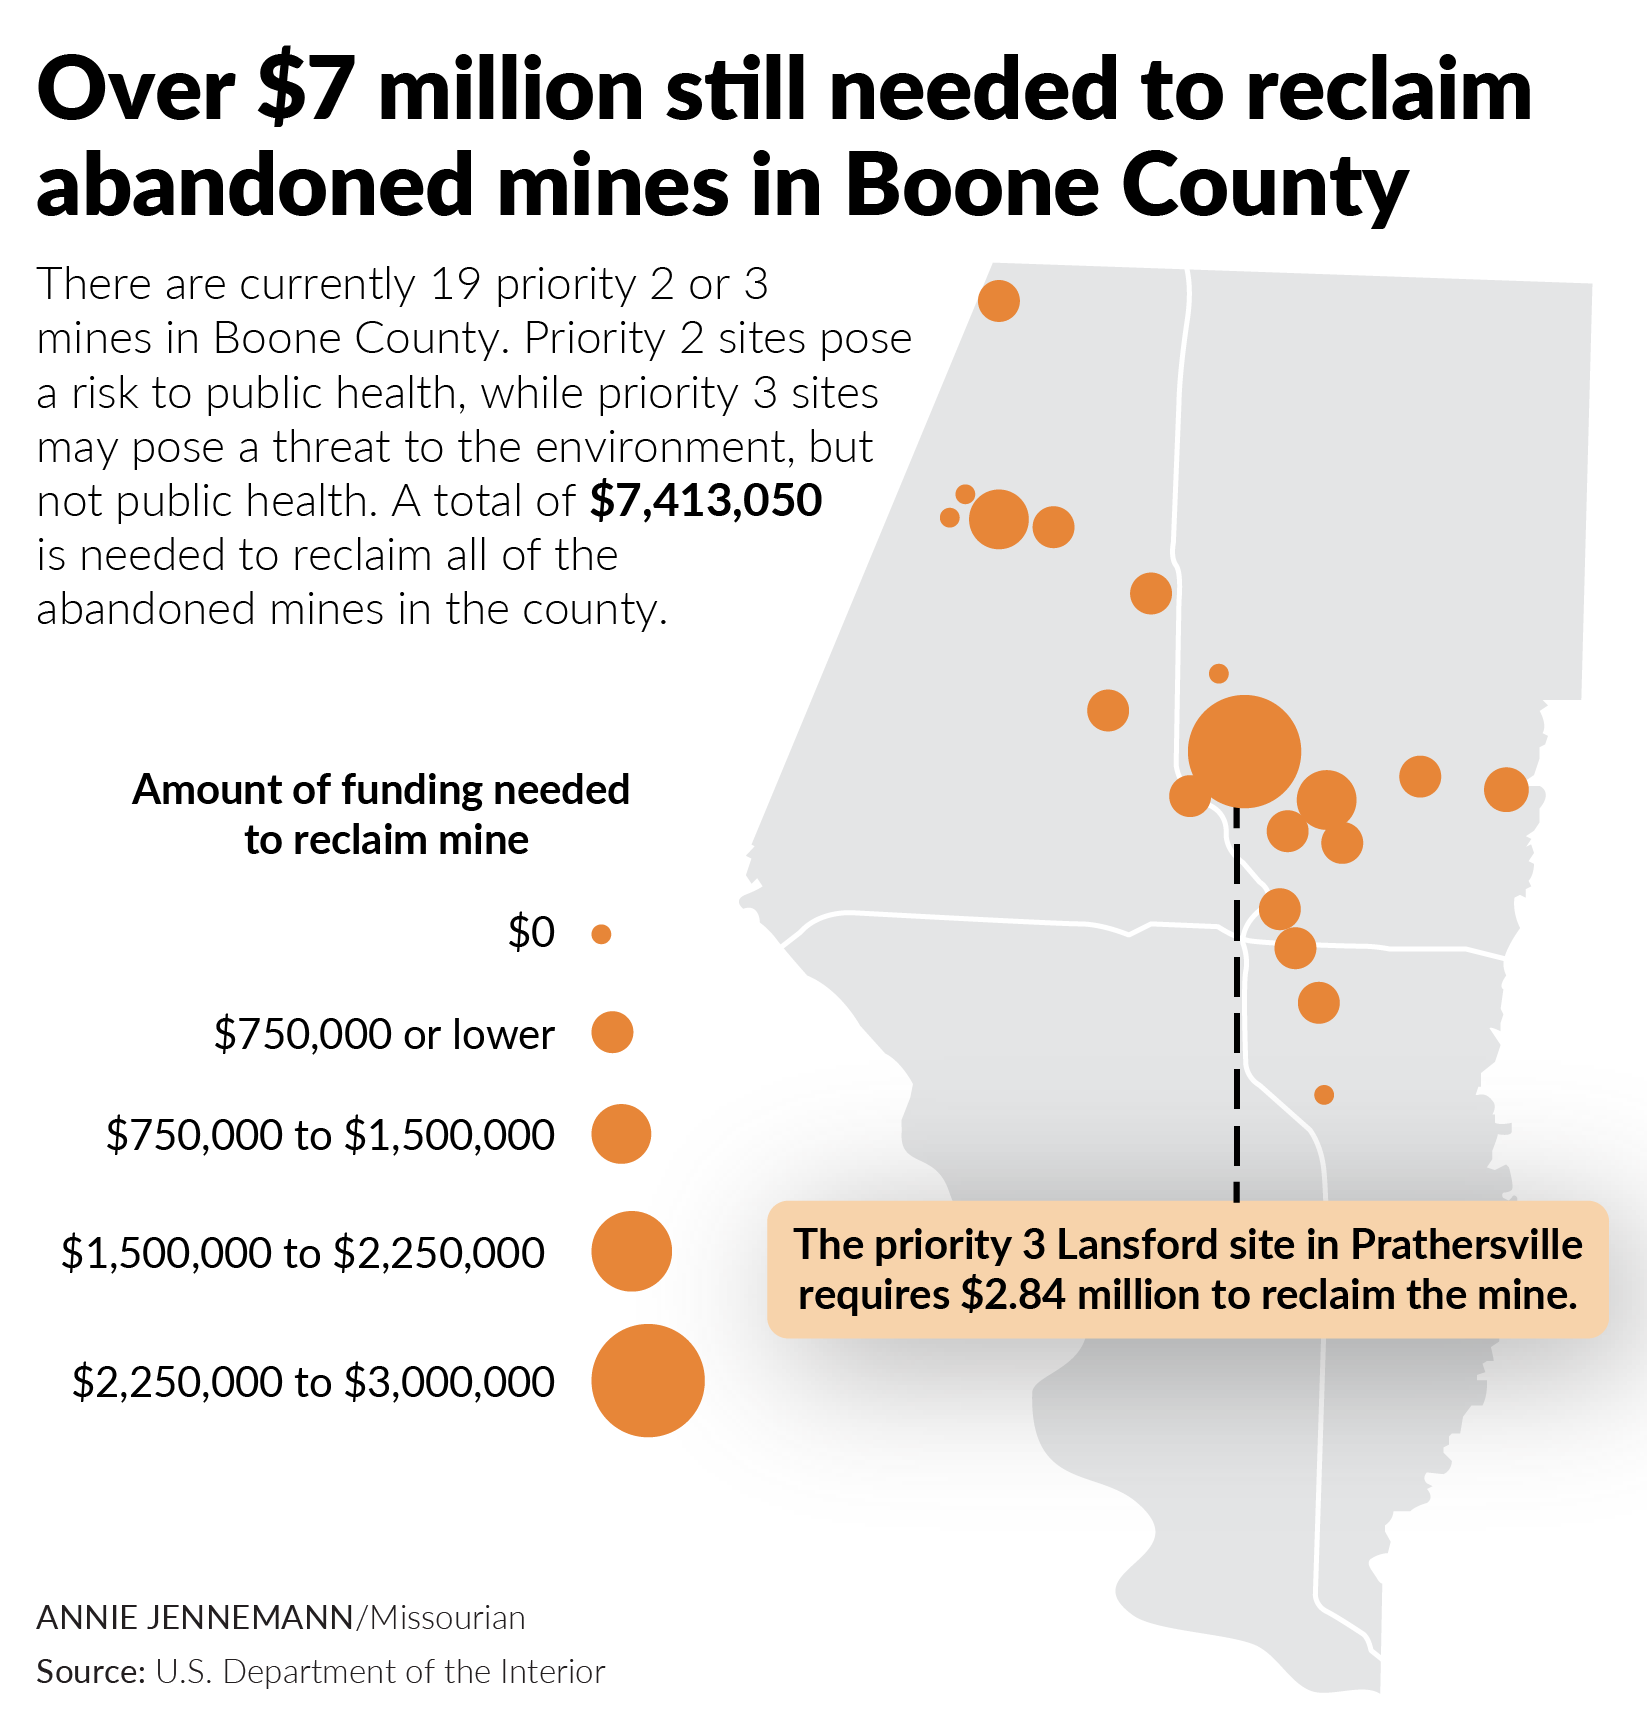
I created this map for a story on coal mines in Boone County for the Columbia Missourian. I used RStudio to clean the data and Adobe Illustrator to design the graphic.

Tools used: RStudio, Adobe Illustrator

Download


A graphic spread showing Boone County 2020 census data. The spread shows an area line chart of Boone County's population over a century where the population in 2020 reached 183,610 people. The spread also shows a bar chart of the top five growing counties in Missouri from 2010 to 2020 where Boone County is the fifth highest growing county, growing 12.89%. The last part of the spread are 8 mini bar charts showing the change in population for people of different races and ethnicities. The data came from the U.S. Census Bureau.

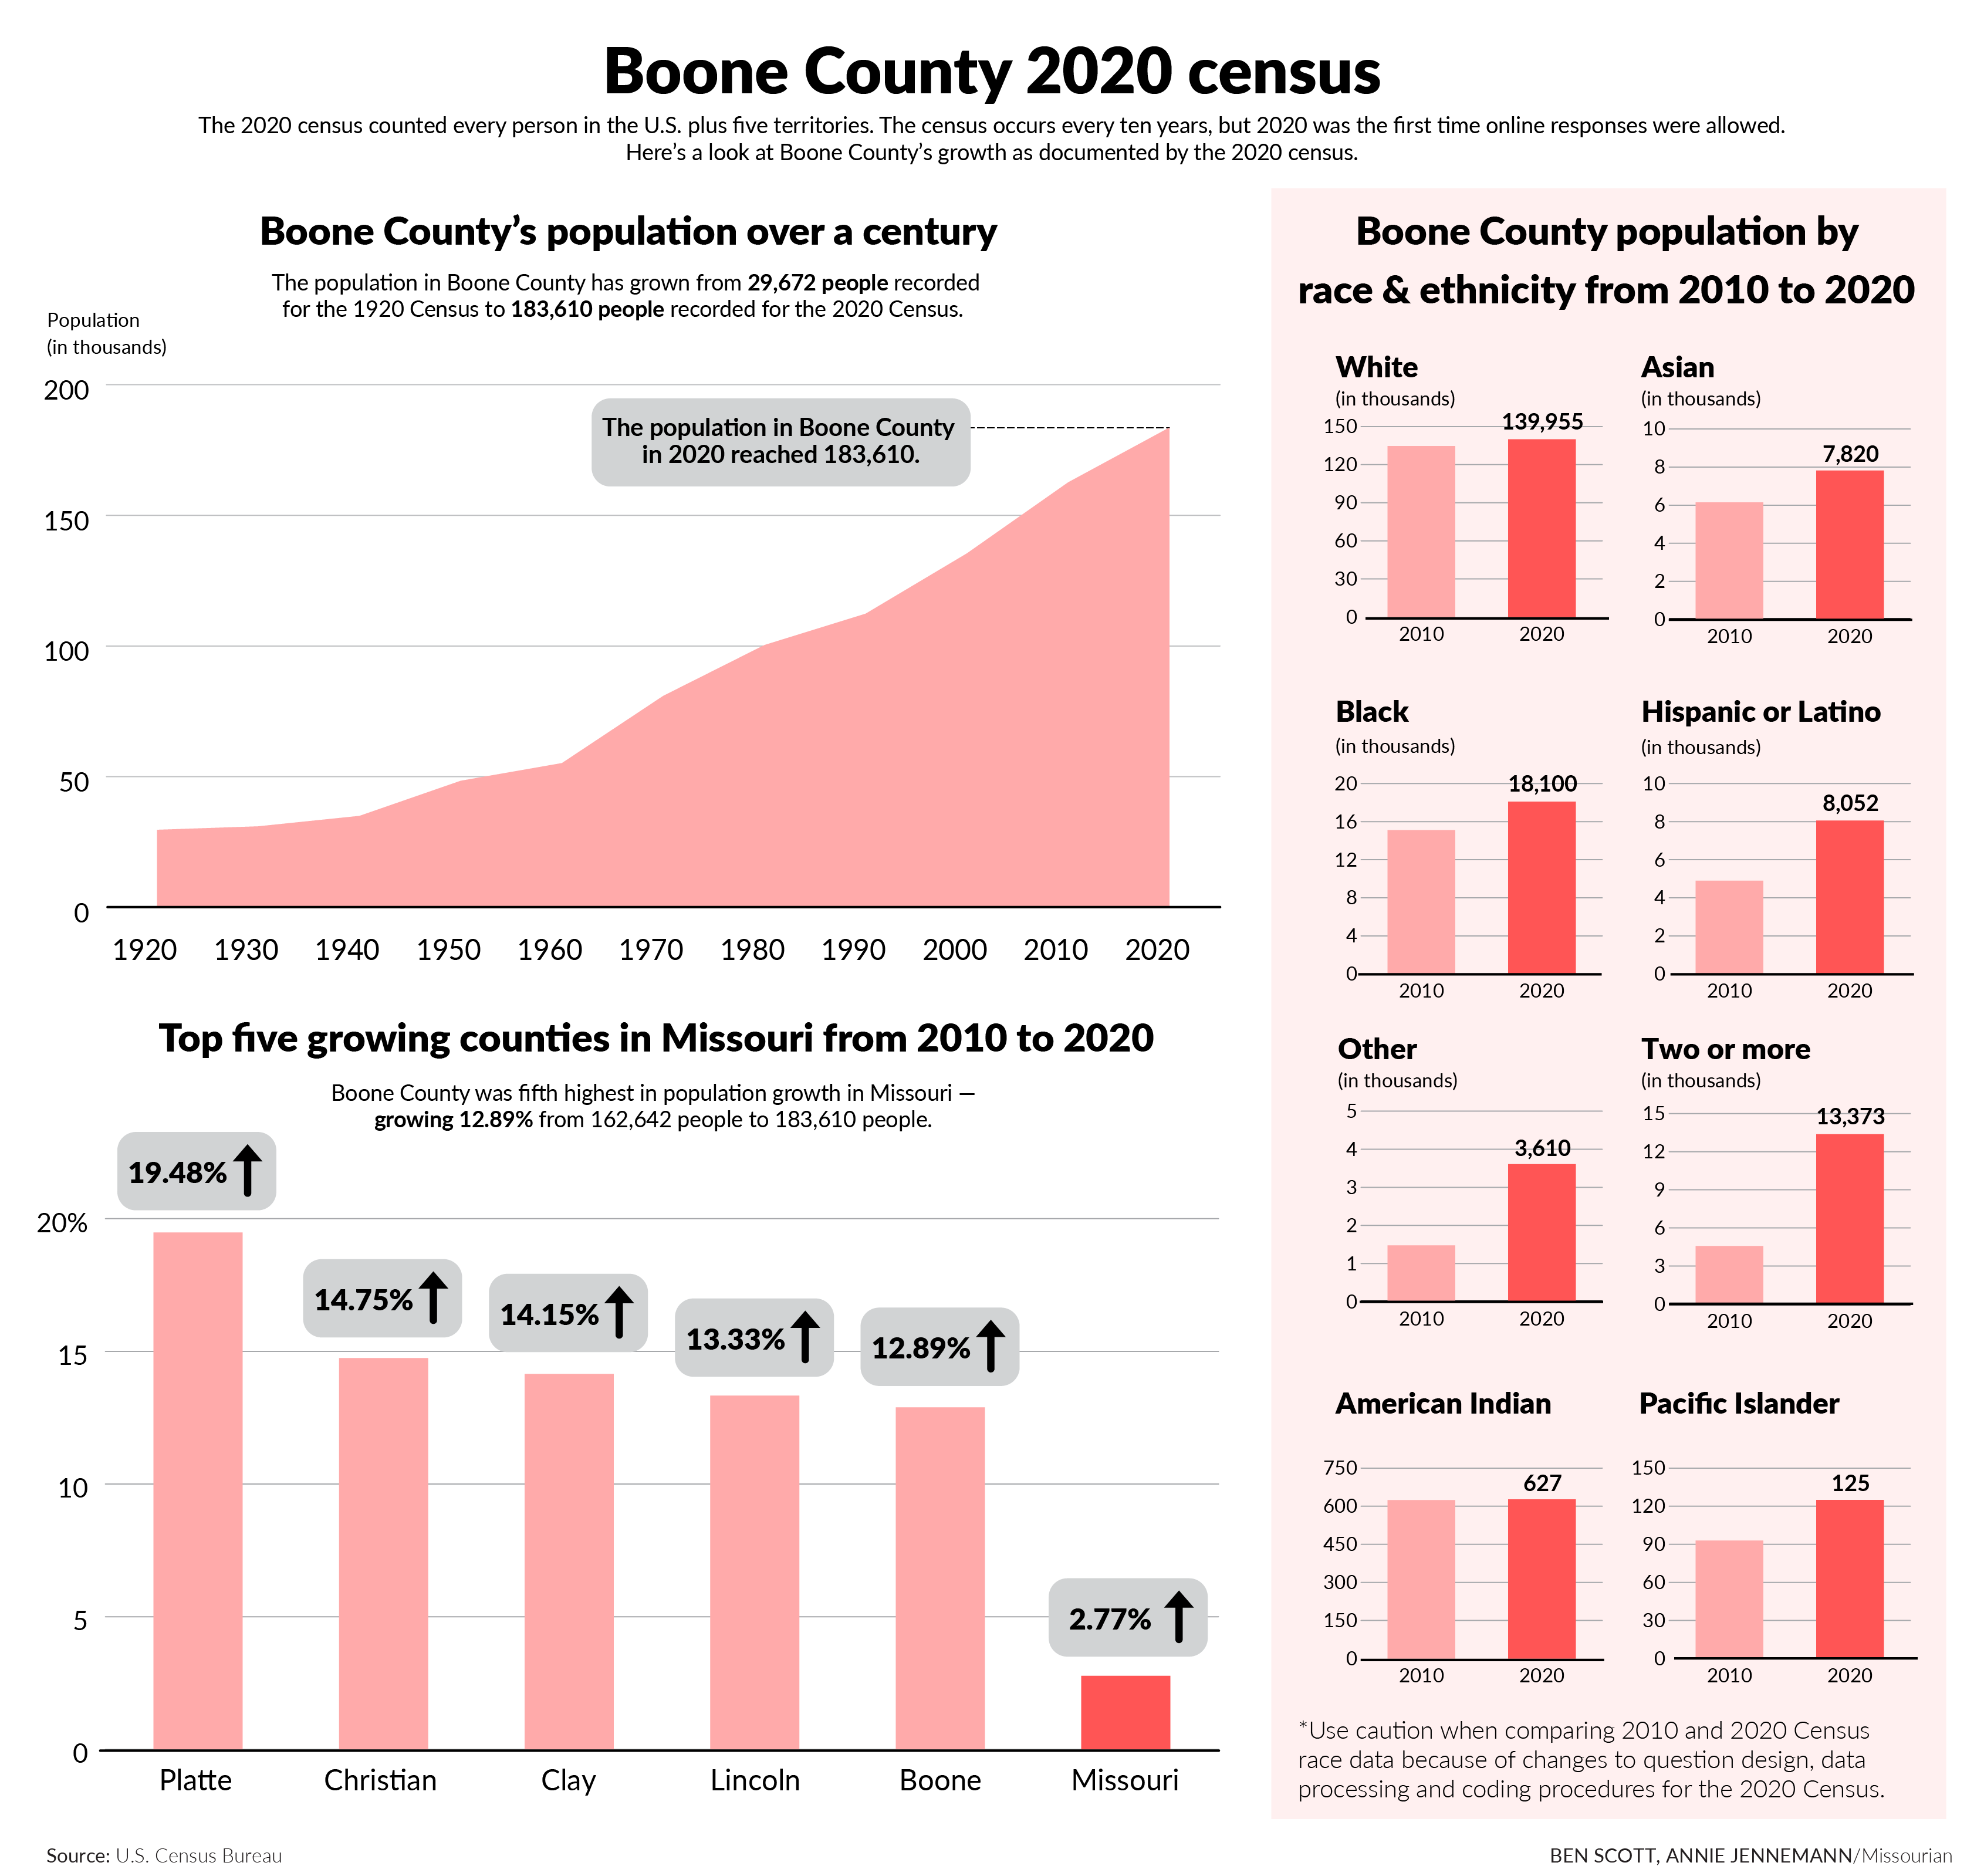
Most recently, I worked with the other graphics editor at the Missourian to create this spread about 2020 census data in Boone County.

Tool used: Adobe Illustrator

Download A timeline graphic showing the history of Missouri from 1250 to present day.

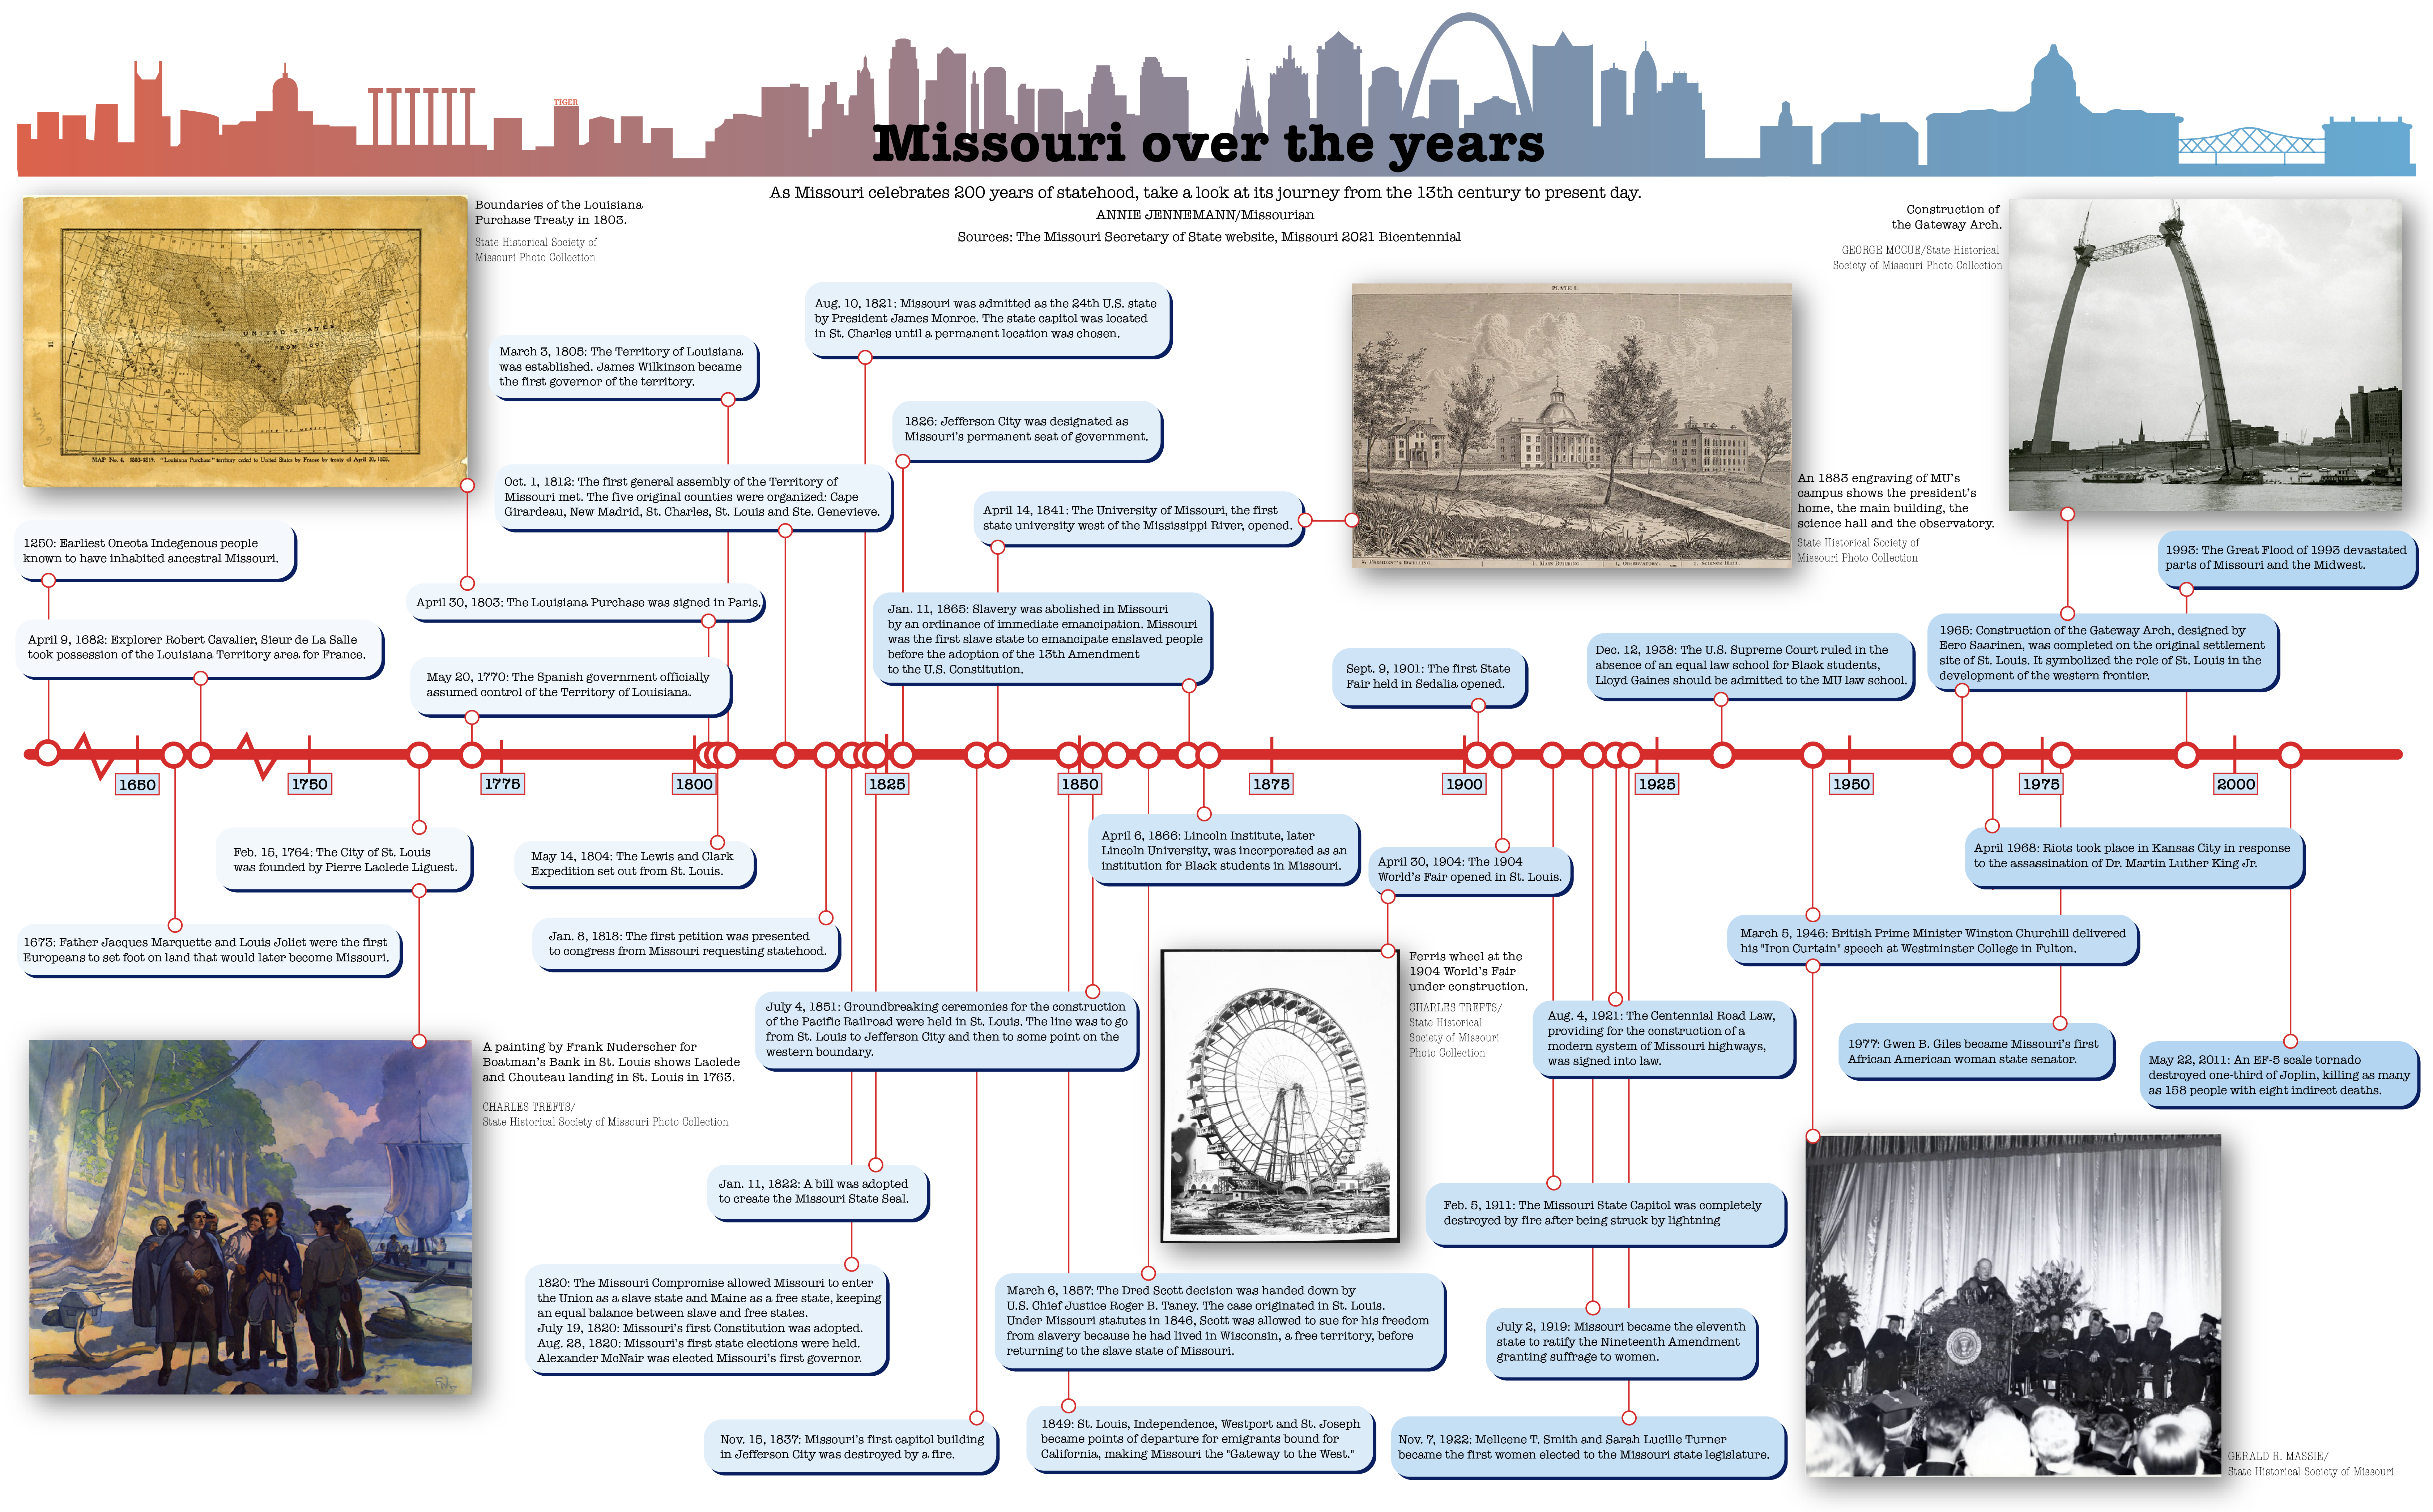
In August, an editor for the Missourian asked me to create a timeline about the history of Missouri in honor of the state's bicentennial. I was given as much space as I needed in the print edition, which resulted in a double-truck timeline that was almost two full pages. I really enjoyed working on this graphic and getting a chance to use my design skills in such a big space.

Tool used: Adobe Illustrator

Download A graphic spread of data about medical marijuana and marijuana arrests in Missouri. The spread includes an area line chart showing marijuana possession arrests from 2010 to 2019 broken down by race, a bar chart of possession arrests by age and sex, a heat map of possession arrests per 100,000 people by state, with Wyoming and South Dakota at the highest arrest rate, and an illustration showing the levels of consequences for possessing different amounts of marijuana. The data came from the FBI and the National Organization for the Reform of Marijuana Laws.

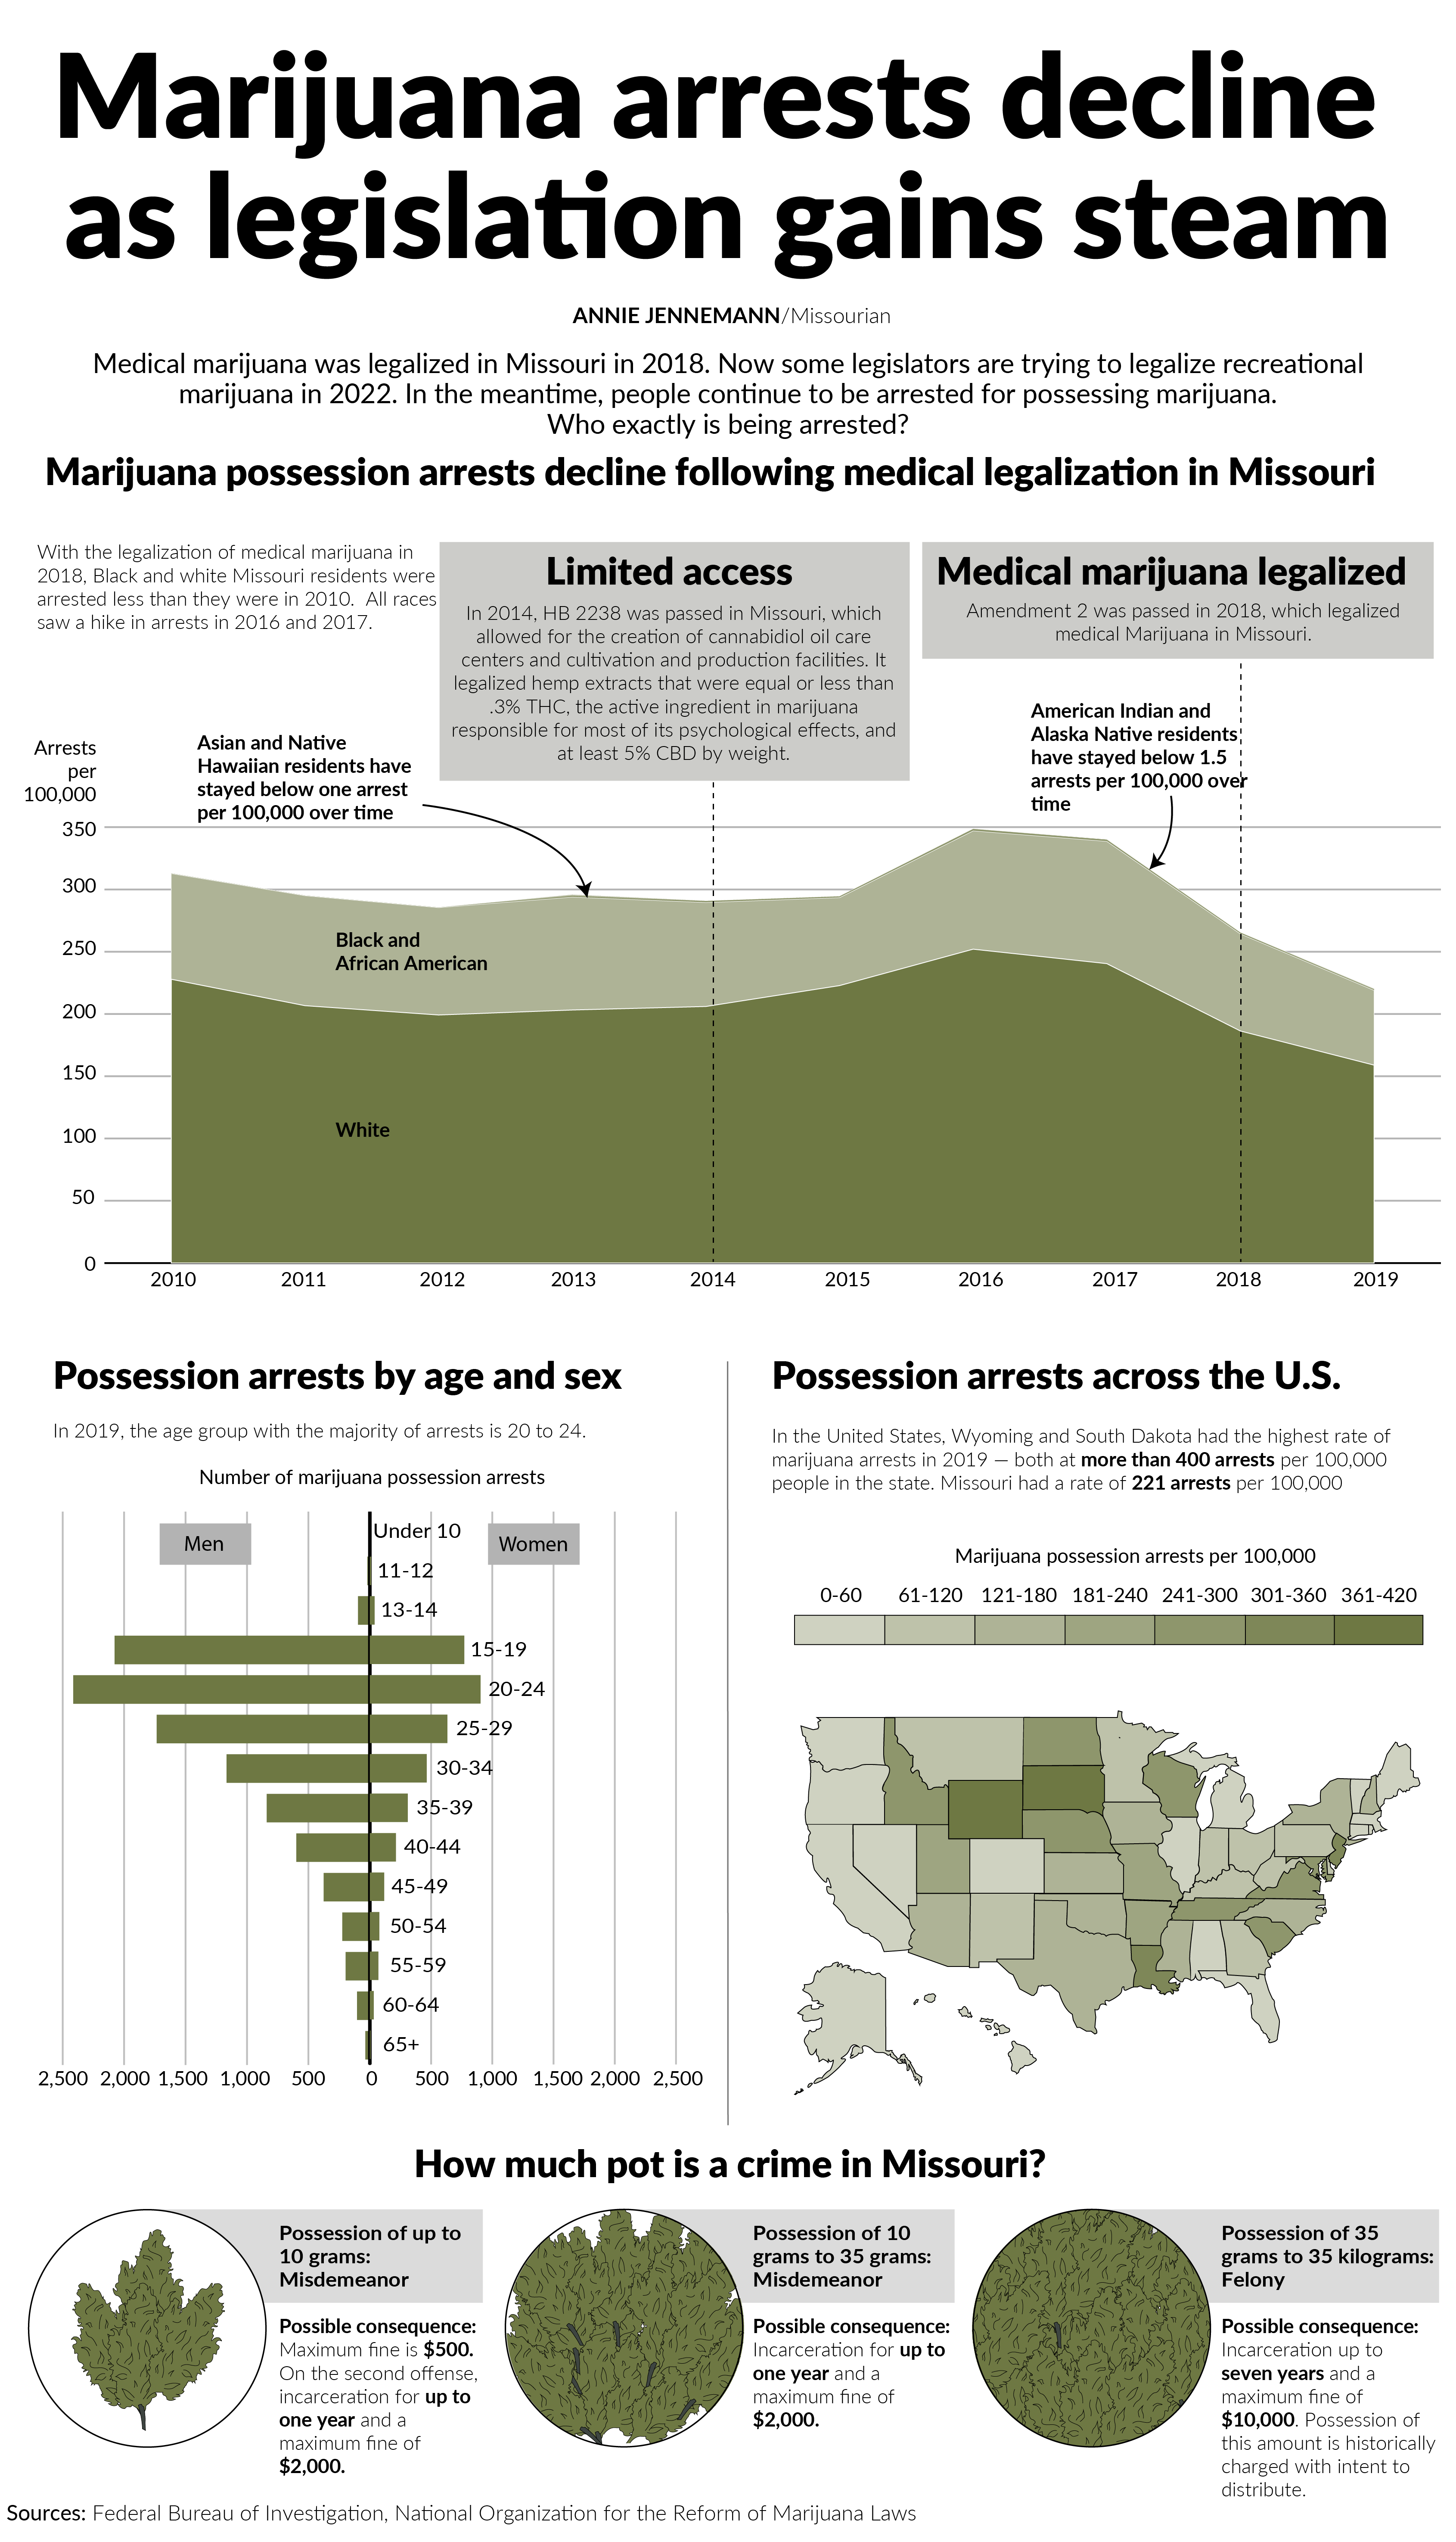
This is a spread about marijuana-related arrests in Missouri that I created for my final project in the information graphics class at MU. It is a full-page and was published in the print edition of the Missourian Jan. 2021.

Tool used: Adobe Illustrator

Download A graphic illustration of the fall colors of five types of leaves in mid-Missouri including a virgina creeper, sugar maple tree, sassafras, oak tree and a sumac tree.

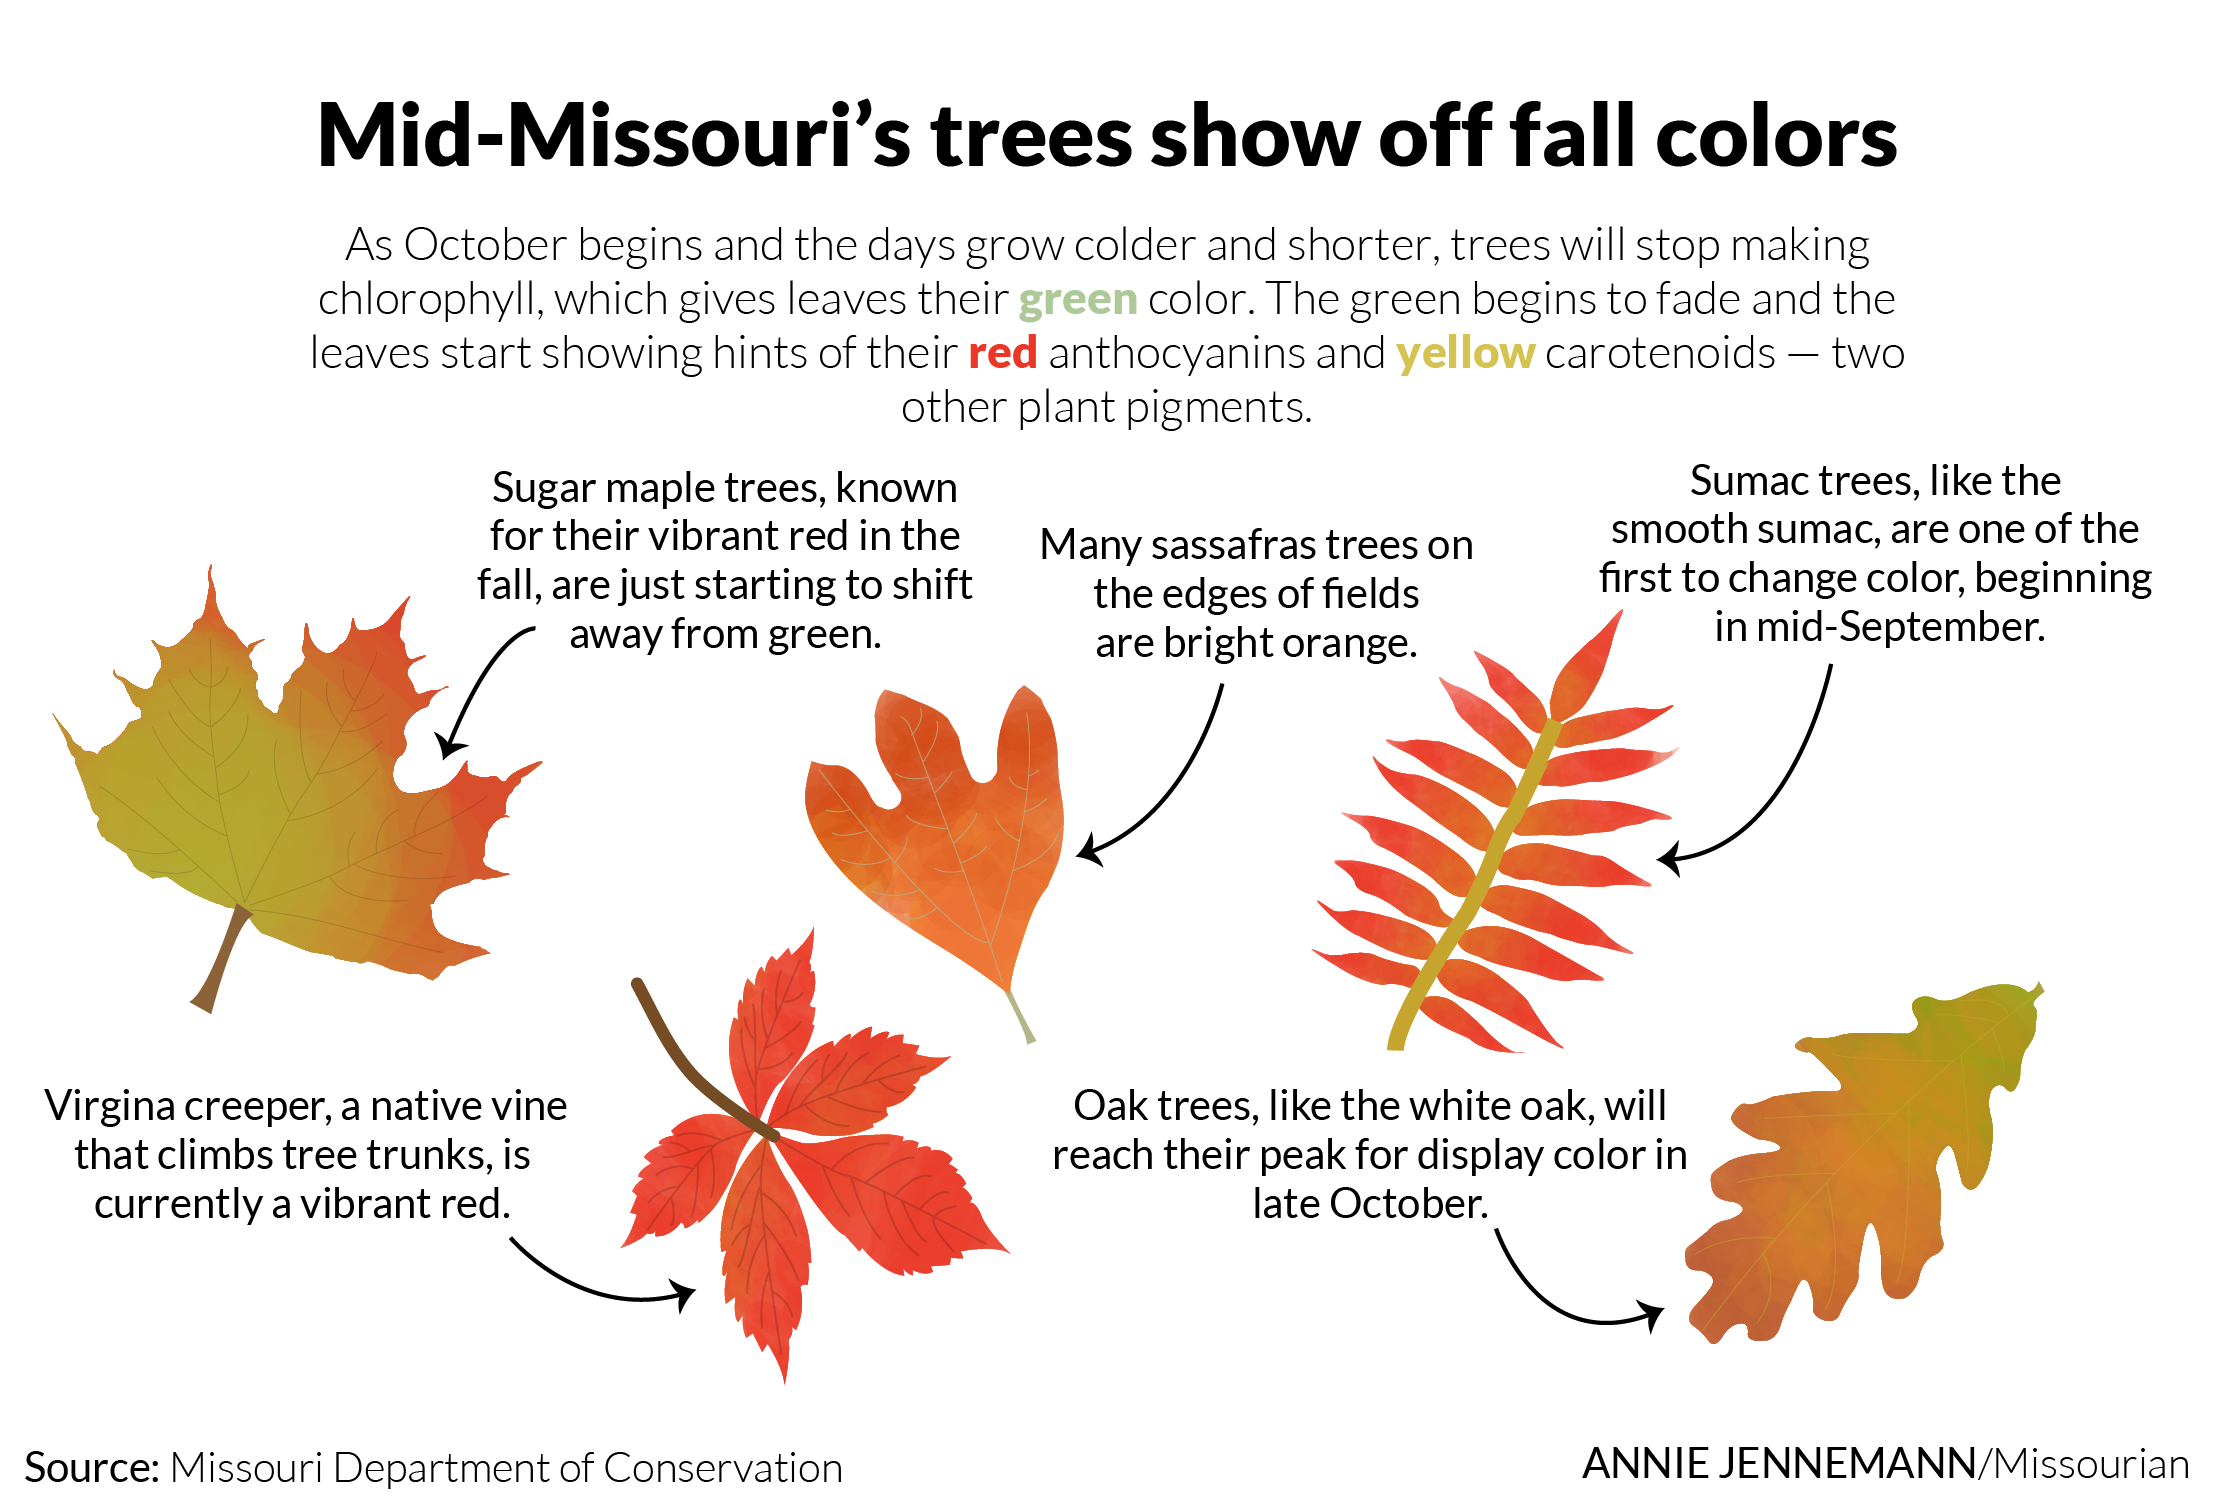
This is a graphic illustration I created on the graphics desk at the Columbia Missourian showing examples of fall colors in trees in mid-Missouri.

Tool used: Adobe Illustrator

Download